Showing posts with label Azure Data Studio. Show all posts

Tuesday, May 7, 2019

Embed Azure Data Studio Notebooks in your website

Notebooks are a functionality available in Azure Data Studio, that allows you to create and share documents that may contain text, code, images, and query results. These documents are helpful to be able to share database insights and create runbooks that you can share easily.

Are you new to notebooks? don't know what are the uses for it? want to know how to create your first notebook? then you can get started in ADS notebooks checking my article for MSSQLTips.com here.

Once you have created your first notebooks and share them among your team, maybe you want to share it on your website or blog for public access.
even when you can share the file for download, you can also embed it on the HTML code.

On this post, I will show you how to do it.

What do you need?


We will use an online HTML converter, nbviewer, provided by Jypiter website, on that homepage, you just have to provide the link of your .ipynb file (my GitHub Notebook repository for this example).

It looks something like this:


After clicking the Go! button, the next window will show you the notebook rendered:


At this point, you could share this link on your site and the user can click on it to see your notebook contents, but what if you want to show the results directly on your website?

Embedding it into your website


You can use the IFrame HTML tag (reference here), with this tag, you can embed an external URL in your HTML code (just be aware of security risks of embedding external code in your application).
the code should look like this:


<iframe
width="600px" height="800px" 
src="your nbviewer URL" >
</iframe>

The final result is this:


Not the best possible way ¯\_(ツ)_/¯, but it is something.

Going further

If you want to fine-tune the above results or host them on your own website, you can check nbviewer GitHub repository so you can use the code locally.

Wednesday, March 13, 2019

Quick tip: Zoom in Azure Data Studio

If you finally have given a try to Azure Data Studio, and if you use it on a regular basis, maybe you want to customize it to suit your needs.

Among the huge customization options it has, you can control the text size in form of zoom. To do change it, just use the following keyboard combinations:

  • (Ctrl + = ) For Zoom in.
  • (Ctrl + - ) For Zoom out.
  • (Ctrl + 0) For Zoom reset.
 You can see it in action:


Also, as with everything on this tool, you can access this functionality from command palette (Ctrl + Shift + P), and type "zoom" (you can fine-control the editor zoom from here):


If you haven't tried it yet, you can download Azure Data Studio here.

Wednesday, January 9, 2019

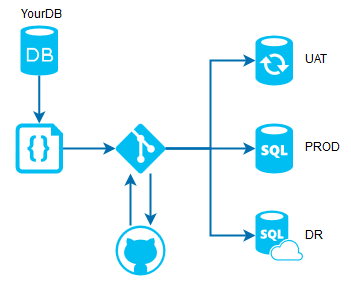
Source Control using Azure Data Studio and GitHub

You can maintain and deploy code easily
Source control is a vital part of IT work, since it is used to track changes over software and documents, with two main benefits: having a centralized, up to date copy of all your applications and utilities, and to be able to rollback to a previous stable version in case of a failed deployment.

This is perfectly applicable to SQL Server, where you want to have an updated and ready to deploy elsewhere copy of your database objects.

There are a lot of source control applications and software, everyone has its pros and cons, but personally, I like to use GitHub, since it is free to use and since it was recently acquired by Microsoft, support for other products is easier (SQL Server for this case).

On this post, I will show you how to implement a source control for a database using GitHub and Azure Data Studio (ADS).

Setting up your machine


First of all, you need to have Azure Data Studio installed and running on your machine, and also a GitHub account to be able to upload and maintain your files.

You will need Git to be able to use source control features in ADS, you can download from here. After downloading it, proceed to install it on your local machine (default features are ok).

To verify Git is installed correctly, just open any command prompt and type git then press enter:


Configuring Azure Data Studio


To be able to use source control on ADS, we have to perform some simple steps:

Open ADS and click on File>Open Folder, locate the folder you want for work and click OK (can be an empty folder for now).
For this example, I am using C:\Repos\SourceControlDB


You can see that now the selected folder appears on the top bar


Once a folder is selected, click on Source Control, located on the left bar


Click on Initialize Repository


And that is all, you are ready to work with source control.


Working with Git

Adding a file to source control


Now we will add an object to our Git folder to see how sourcing works.
Open any already created database object or a TSQL query on ADS IDE


Save it on your Git Folder with a meaningful name


Once saved, you can see the file is added to the source control as an untracked change


Just select the changes you want to commit (in case you have more open files) and then click on Commit on the upper right corner of the source control area


Since the changes have not been staged, a message box asking to do it automatically, click on Yes


Provide a meaningful commit message and press Enter


Now the file has been added to source control successfully.

Editing the file


We now proceed to do a simple change in the stored procedure


At the moment you save the file, you can notice that a new change is added to source control and modified or added lines are marked on the file


If you click on the change, you can now see the actual changes made to the file


If you are Ok with the changes, commit them using the same option as earlier, and that is the basic Git usage.


We will cover the rollback, merge and some other features on the next post.

Now we will learn how to upload your local Git files to GitHub.


Linking your repository to GitHub the first time


The easiest way is using your GitHub profile, so let's do it...

Create a new repository on your profile with the options you want, and click on Create Repository


In the next step copy the code for pushing an existing Git repository


Open a new command prompt, navigate to your Git folder and paste the code there, one line at a time


In my case for the first line, the origin already exists so it will throw an error, but for your first time it will execute ok, for the second line, after a few moments it will ask you for username and password


After a few moments (depending on your folder size) files will be uploaded and now your repository is uploaded to GitHub successfully (as long with all the versions you have)


You have successfully linked your Git folder with GitHub, as you can see the file is uploaded


Your GitHub is now linked


Since we have done the linking, you can upgrade existing or add new files and they will be uploaded to GitHub when you commit the changes and sync them.

We perform another quick change to our file and commit it


Then we click on Sync to synchronize with GitHub


After the process ends, if you check your GitHub repository you can see the new change


Now you have configured your environment to support source control directly to GitHub. On the next post, we will see some other advanced options, like perform the sync automatically.
Also, we will learn how to pull those files from another place and apply them to other SQL Server instance.
Monday, September 10, 2018

Different methods to generate query execution plans

One of the things I enjoy about my job is when I have to develop or review some T-SQL code, for my own projects or reviewing someones else code. In both cases, you often have to tune some queries or review them to see if there is room for some performance improvement.

An Execution plan is the method SQL Server engine will choose to execute (or would use if is an estimated plan) any given query based on the object indexes and statistics, server load, parameters, tables involved, operators, conversions, to provide the optimal execution time and the minimum resource usage. For human analysis, these are stored on .sqlplan or .xml extensions so you can save and analyze them later or on another machine from where it was generated.

For this type of analysis, you need to check execution plans, and it is important that you know how to generate and save them to be shared or for later analysis. On this post, we will discuss a wide range of the options you have to generate and save an execution plan.


1. Using SSMS


Just select the Include Actual Execution Plan (Ctrl +M) on the toolbar as follows:


To save the execution plan


Right Click on the execution plan and select Save Execution Plan As...


2. Using SQL Server Operations Studio


When executing a query select the Explain option at the right:


3. Using T-SQL: SHOWPLAN_TEXT


This method represents the execution plan in a text format, using rows in a hierarchical tree representation.

Useful when you don't want a graphical interface or you are using a command line tool.
To enable it, just execute the following statement at the beginning of your code, and set if off once done:


SET SHOWPLAN_TEXT ON;
GO

-- YOUR QUERY GOES HERE!
GO

SET SHOWPLAN_TEXT OFF;
GO

Please note that using this option, the query is not executed, only the execution plan is generated.
The results look something like this:


4. Using T-SQL: SHOWPLAN_ALL


Similar to the previous method, this one displays the execution plan in a text format, using rows in a hierarchical tree representation.

This option also does not execute the query and provide us with more detailed information than the showplan_text, also useful when using a command-line tool.

To use it, just use the following T-SQL code:


SET SHOWPLAN_ALL ON;
GO

-- Your query goes here!
GO

SET SHOWPLAN_ALL OFF;
GO

And these are the results:


5. Using T-SQL: SHOWPLAN_XML


This method generates the execution plan in an XML format (the .sqlplan files are stored as XML) and when generated from a graphical interface, like SSMS, if you click on it, it will display it graphically.

As with SHOWPLAN_TEXT and SHOWPLAN_ALL, this option does not execute the query, only generates the estimated execution plan.

To use it, just use the following T-SQL:


SET SHOWPLAN_XML ON;
GO

-- Your query goes here!
GO

SET SHOWPLAN_XML OFF;
GO

And the output looks like this:


The previous options are more suited when you have access to the actual query, and you are developing/tuning a particular statement, but if you need to generate plans for previous queries executed on the servers you have 3 options: DMVs, Extended Events, and QueryStore:


6. Using Dynamic Management Objects


Using the DMF: sys.dm_exec_query_plan, you can generate execution plans for any active session or sessions in the cache for your SQL Server instance, the output is given in an XML format that you can use in SSMS or save for later analysis.

This is a sample usage of the DMF using info from the cached plan with the DMV sys.dm_exec_query_stats, you can use another object if you want:


SELECT  
 ph.query_plan, 
 qs.* 
FROM sys.dm_exec_query_stats AS qs  
CROSS APPLY sys.dm_exec_query_plan(qs.plan_handle) ph;

This is the output of the query:


7. Using Extended Events


In this post, I explain how to create an Extended Event, just create your session and select any event you want to track.

In the global fields to capture, just select the event Plan Handle:


With this field, you can use the DMF sys.dm_exec_query_plan to obtain the execution plan.

Note: this method only works for cached execution plans, otherwise the DMF will return NULL.
even when you can capture and persist execution plans out of the cache with extended events, this is a very resource intensive task that I don't recommend to do, that is why that method is out of scope on this post.


8. Using Query Store


Since this option is not available in all SQL Servers, it was introduced in SQL Server 2016 and also you have to enable Query Store, I left this option as the last one, but it is also important to know how to obtain an execution plan from it.

If you have Query Store already enabled on your database, just navigate to your database and select the Query Store folder, in there expand it and select any of the reports you want to analyze, for this example we will use Top Resource Consuming Queries:


The bars will show you the most resource-intensive queries in descending order, so just select any bar and you will see the current execution plan used at the bottom.

We will not discuss all the capabilities of Query Store on this post, but if you have more than one execution plan for a query, the different execution plans can be selected on the circles at the right side:


We have discussed a lot of different options you have to generate execution plans. In some later posts, we will use the info obtained to tune queries.


For further reading about execution plans, you can access this link:

https://www.red-gate.com/simple-talk/sql/performance/execution-plan-basics/


Monday, May 14, 2018

Quick charts in SQL Server Operations Studio

Sample chart for quick insights
SQL Server Operations Studio will be a new tool for managing SQL Server, Azure SQL Database, and Azure SQL Data Warehouse, this tool is not meant to replace SSMS, and is focused more to Database Developers than for Database Administrators.

On this post I want to share with you an option to create quick charts from the results window.


View data as chart


Open SQL Server Operations Studio and select a new query (Ctrl + N)


Once you have your new query window and you are connected to your server, write your query (just note that since this is a quick function, it won't work properly for complex charts)


Run your query clicking the run button or hitting F5 (Ctrl +F5 for selected text) and once the results are displayed, select the View as Chart option in the right of the results window


When you click this option, an horizontal bar chart will open by default, but you can change the chart type on the right side


Also if you hover the mouse over a point, it will display the value.
You can save the chart also if you want or create an Insight template with the options above the chart.


And that's all. As you can see, the customization options are very limited, but the product is still in preview, so new features can come in newer releases.

If you haven't download the SQL Server Operations Studio, you can do it from Microsoft Site here


More info:

What is Microsoft SQL Operations Studio (preview)?

How I Built RAG for My Accounting App on Bedrock and pgvector

The first version of my accounting assistant could not find a single purchase of "comida" in a database full of lunches, misse...