Showing posts with label Scripts. Show all posts

Tuesday, May 7, 2019

Embed Azure Data Studio Notebooks in your website

Notebooks are a functionality available in Azure Data Studio, that allows you to create and share documents that may contain text, code, images, and query results. These documents are helpful to be able to share database insights and create runbooks that you can share easily.

Are you new to notebooks? don't know what are the uses for it? want to know how to create your first notebook? then you can get started in ADS notebooks checking my article for MSSQLTips.com here.

Once you have created your first notebooks and share them among your team, maybe you want to share it on your website or blog for public access.
even when you can share the file for download, you can also embed it on the HTML code.

On this post, I will show you how to do it.

What do you need?


We will use an online HTML converter, nbviewer, provided by Jypiter website, on that homepage, you just have to provide the link of your .ipynb file (my GitHub Notebook repository for this example).

It looks something like this:


After clicking the Go! button, the next window will show you the notebook rendered:


At this point, you could share this link on your site and the user can click on it to see your notebook contents, but what if you want to show the results directly on your website?

Embedding it into your website


You can use the IFrame HTML tag (reference here), with this tag, you can embed an external URL in your HTML code (just be aware of security risks of embedding external code in your application).
the code should look like this:


<iframe
width="600px" height="800px" 
src="your nbviewer URL" >
</iframe>

The final result is this:


Not the best possible way ¯\_(ツ)_/¯, but it is something.

Going further

If you want to fine-tune the above results or host them on your own website, you can check nbviewer GitHub repository so you can use the code locally.

Monday, February 11, 2019

Quick tip: Speeding up deletes from SSIS execution log

If you have SQL Server Integration Services installed on your server, and you left the default configurations a table named sysssislog is created on MSDB database, it contains logging entries for packages executed on that instance.

If you are not careful enough, this table can grow uncontrollably over time and can make subsequent insertions very slow.

A proper deletion process must be put in place, so you not get into situations like this one in your msdb database:


If you are already on this situation, you can the following T-SQL Script to delete records by batches:


DECLARE @date_del datetime,
  @batch_size int = 1000, -- will delete on batches of 1000 records
  @RowsAffected int =1

-- Time to keep in the history, in our case 1 month
SET @date_del= DATEADD(mm,-1,getdate()); 

SET NOCOUNT ON;

WHILE (@RowsAffected >0)
BEGIN
 DELETE TOP(@batch_size) 
 FROM [dbo].[sysssislog]
 WHERE starttime < @date_del;

 SET @RowsAffected = @@ROWCOUNT;

 -- If you want to know rows affected, uncomment this:
 -- PRINT @RowsAffected;
END

SET NOCOUNT OFF;


After that you can implement the same query to your msdb maintenance job to have all in one place.

Wednesday, January 9, 2019

Source Control using Azure Data Studio and GitHub

You can maintain and deploy code easily
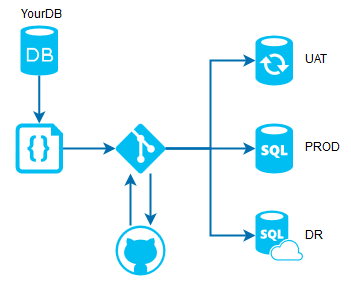
Source control is a vital part of IT work, since it is used to track changes over software and documents, with two main benefits: having a centralized, up to date copy of all your applications and utilities, and to be able to rollback to a previous stable version in case of a failed deployment.

This is perfectly applicable to SQL Server, where you want to have an updated and ready to deploy elsewhere copy of your database objects.

There are a lot of source control applications and software, everyone has its pros and cons, but personally, I like to use GitHub, since it is free to use and since it was recently acquired by Microsoft, support for other products is easier (SQL Server for this case).

On this post, I will show you how to implement a source control for a database using GitHub and Azure Data Studio (ADS).

Setting up your machine


First of all, you need to have Azure Data Studio installed and running on your machine, and also a GitHub account to be able to upload and maintain your files.

You will need Git to be able to use source control features in ADS, you can download from here. After downloading it, proceed to install it on your local machine (default features are ok).

To verify Git is installed correctly, just open any command prompt and type git then press enter:


Configuring Azure Data Studio


To be able to use source control on ADS, we have to perform some simple steps:

Open ADS and click on File>Open Folder, locate the folder you want for work and click OK (can be an empty folder for now).
For this example, I am using C:\Repos\SourceControlDB


You can see that now the selected folder appears on the top bar


Once a folder is selected, click on Source Control, located on the left bar


Click on Initialize Repository


And that is all, you are ready to work with source control.


Working with Git

Adding a file to source control


Now we will add an object to our Git folder to see how sourcing works.
Open any already created database object or a TSQL query on ADS IDE


Save it on your Git Folder with a meaningful name


Once saved, you can see the file is added to the source control as an untracked change


Just select the changes you want to commit (in case you have more open files) and then click on Commit on the upper right corner of the source control area


Since the changes have not been staged, a message box asking to do it automatically, click on Yes


Provide a meaningful commit message and press Enter


Now the file has been added to source control successfully.

Editing the file


We now proceed to do a simple change in the stored procedure


At the moment you save the file, you can notice that a new change is added to source control and modified or added lines are marked on the file


If you click on the change, you can now see the actual changes made to the file


If you are Ok with the changes, commit them using the same option as earlier, and that is the basic Git usage.


We will cover the rollback, merge and some other features on the next post.

Now we will learn how to upload your local Git files to GitHub.


Linking your repository to GitHub the first time


The easiest way is using your GitHub profile, so let's do it...

Create a new repository on your profile with the options you want, and click on Create Repository


In the next step copy the code for pushing an existing Git repository


Open a new command prompt, navigate to your Git folder and paste the code there, one line at a time


In my case for the first line, the origin already exists so it will throw an error, but for your first time it will execute ok, for the second line, after a few moments it will ask you for username and password


After a few moments (depending on your folder size) files will be uploaded and now your repository is uploaded to GitHub successfully (as long with all the versions you have)


You have successfully linked your Git folder with GitHub, as you can see the file is uploaded


Your GitHub is now linked


Since we have done the linking, you can upgrade existing or add new files and they will be uploaded to GitHub when you commit the changes and sync them.

We perform another quick change to our file and commit it


Then we click on Sync to synchronize with GitHub


After the process ends, if you check your GitHub repository you can see the new change


Now you have configured your environment to support source control directly to GitHub. On the next post, we will see some other advanced options, like perform the sync automatically.
Also, we will learn how to pull those files from another place and apply them to other SQL Server instance.
Monday, November 12, 2018

Load and run custom T-SQL scripts in SSMS via Snippets

If you work with SQL Server on a daily basis, it is very likely you have a lot of custom scripts you have to execute frequently, maybe you have stored them on a folder and you open them manually as you need them, or have saved them on a solution or project file, maybe you execute a custom .bat or PowerShell file to load them when you open SSMS...

Every method has its pros and cons, and on this post, I will show you a new method to load your custom scripts on any open query window on SSMS via Snippets.

What is a Snippet?


According to Microsoft Documentation:
Code snippets are small blocks of reusable code that can be inserted in a code file using a context menu command or a combination of hotkeys. They typically contain commonly-used code blocks such as try-finally or if-else blocks, but they can be used to insert entire classes or methods.

In short words is custom code (T-SQL Scripts for us) that you use a lot and you want to have always available to use.
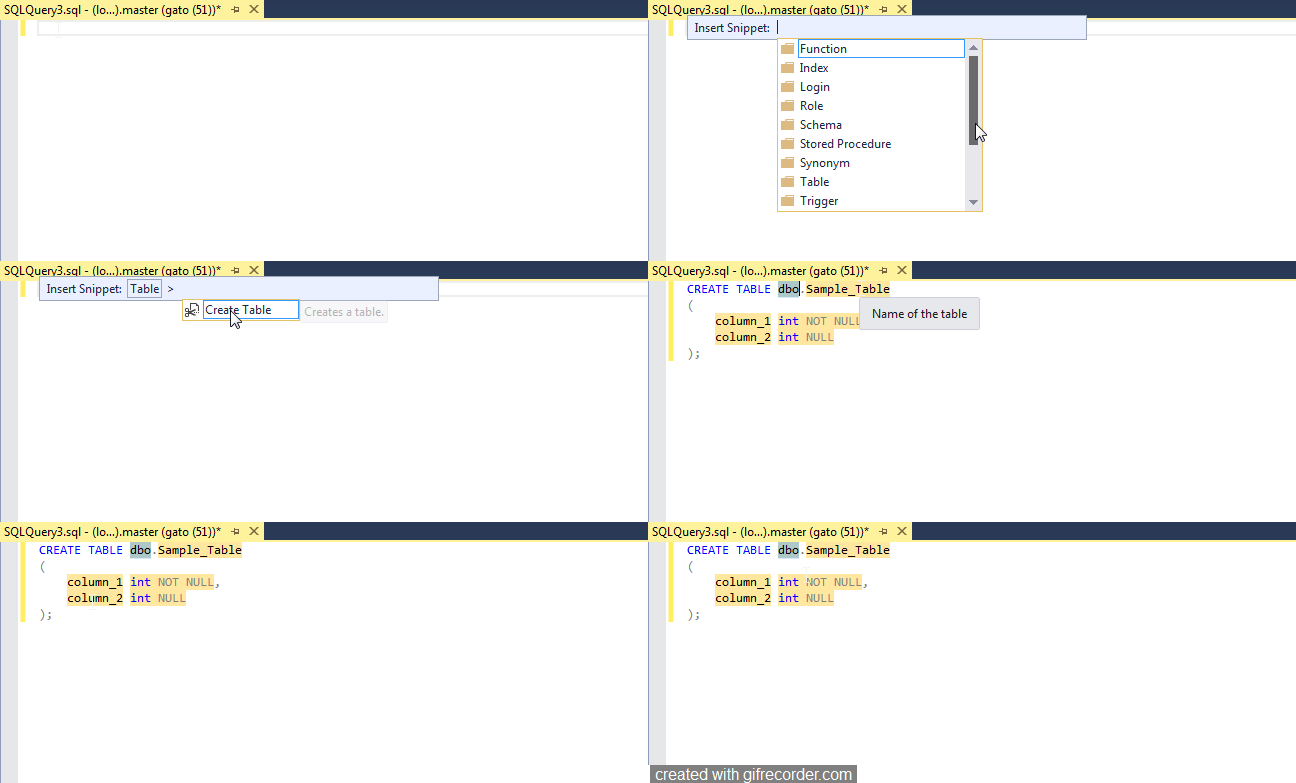
In SSMS there are a lot of code snippets available by default, that you can use right away, let us see one of them in action, we will use a snippet to insert a create table template:


You can see how easy is to load the code in any existing window, even if this already has code on it, so now let us create one with our custom code.


Creating a custom Snippet


These files are stored in XML format with a .snippet extension, you can find the official documentation here.

The basic template is this (you can find the file on my GitHub):


<?xml version="1.0" encoding="utf-8" ?>
<CodeSnippets xmlns="http://schemas.microsoft.com/VisualStudio/2005/CodeSnippet">
 <CodeSnippet Format="1.0.0">
 <Header>
 <Title>Your Snippet title</Title>
        <Shortcut></Shortcut>
 <Description>Your snippet description</Description>
 <Author>Author of the snippet</Author>
 <SnippetTypes>
  <SnippetType>Expansion</SnippetType>
 </SnippetTypes>
 </Header>
 <Snippet>
  <Declarations>
   <Literal>
    <ID>Variable1</ID>
    <ToolTip>Variable1 description</ToolTip>
    <Default>variable1 default value</Default>
   </Literal>
  </Declarations>
  <Code Language="SQL">
<![CDATA[
SELECT $Variable1$
]]>
  </Code>
 </Snippet>
 </CodeSnippet>
</CodeSnippets>

Explaining it:

  • You need to insert your custom code inside the <![CDATA[]]> label. 
  • If you have variables, you must enclose them in $ characters ($Variable1$ for our template, and then declaring the variable with the name you use inside the <Declarations> section.
  • Then declare the Script name, description, and author in the <Header> section.
  • Save it with the .snippet extension.
I have a simple script that I use a lot to see the elapsed and remaining time for any session on SQL server, so let us use it for this example, the query is the following (Note: I didn't make this script, but I was not able to find the author, so if you know him/her, please let me know so I can give the proper credit):


SELECT 
 r.session_id,
 r.command,
 CONVERT(NUMERIC(6,2),r.percent_complete) AS [Percent Complete],
 CONVERT(VARCHAR(20),DATEADD(ms,r.estimated_completion_time,GetDate()),20) AS [ETA Completion Time],
 CONVERT(NUMERIC(10,2),r.total_elapsed_time/1000.0/60.0) AS [Elapsed Min],
 CONVERT(NUMERIC(10,2),r.estimated_completion_time/1000.0/60.0) AS [ETA Min],
 CONVERT(NUMERIC(10,2),r.estimated_completion_time/1000.0/60.0/60.0) AS [ETA Hours],
 CONVERT(VARCHAR(1000),(SELECT SUBSTRING(text,r.statement_start_offset/2,
 CASE WHEN r.statement_end_offset = -1 
 THEN 1000 ELSE (r.statement_end_offset-r.statement_start_offset)/2 END)
FROM sys.dm_exec_sql_text(sql_handle)))AS [SQL Text]
FROM sys.dm_exec_requests r WHERE command LIKE  '%%' --Text of the Session you want to monitor, like BACKUP or DBCC


For this script, our variable will be the text in the like statement, so after using the snippet template, our code should look like this:

<?xml version="1.0" encoding="utf-8" ?>
<CodeSnippets xmlns="http://schemas.microsoft.com/VisualStudio/2005/CodeSnippet">
 <CodeSnippet Format="1.0.0">
 <Header>
 <Title>Running Queries ETA</Title>
        <Shortcut></Shortcut>
 <Description>Display estimated completed time for any given query</Description>
 <Author>SQLGuatemala.com</Author>
 <SnippetTypes>
  <SnippetType>Expansion</SnippetType>
 </SnippetTypes>
 </Header>
 <Snippet>
  <Declarations>
   <Literal>
    <ID>YourCommand</ID>
    <ToolTip>Command to look for</ToolTip>
    <Default>BACKUP</Default>
   </Literal>
  </Declarations>
  <Code Language="SQL">
   <![CDATA[
SELECT 
 r.session_id,
 r.command,
 CONVERT(NUMERIC(6,2),r.percent_complete) AS [Percent Complete],
 CONVERT(VARCHAR(20),DATEADD(ms,r.estimated_completion_time,GetDate()),20) AS [ETA Completion Time],
 CONVERT(NUMERIC(10,2),r.total_elapsed_time/1000.0/60.0) AS [Elapsed Min],
 CONVERT(NUMERIC(10,2),r.estimated_completion_time/1000.0/60.0) AS [ETA Min],
 CONVERT(NUMERIC(10,2),r.estimated_completion_time/1000.0/60.0/60.0) AS [ETA Hours],
 CONVERT(VARCHAR(1000),(SELECT SUBSTRING(text,r.statement_start_offset/2,
 CASE WHEN r.statement_end_offset = -1 
 THEN 1000 ELSE (r.statement_end_offset-r.statement_start_offset)/2 END)
FROM sys.dm_exec_sql_text(sql_handle)))AS [SQL Text]
FROM sys.dm_exec_requests r WHERE command LIKE  '%$YourCommand$%'
]]>
  </Code>
 </Snippet>
 </CodeSnippet>
</CodeSnippets>


We save it with the .snippet extension to a folder in our computer, the next step is to load it to SSMS.


Loading the Snippet into SSMS


Open SSMS and go to Tools> Code Snippets Manager


The following window will open. If you want to load a complete snippet folder, click on Add, or if you want to load just one snippet, click on Import.


For this example we will load the entire folder where we store the snippet template and the one we created in the previous step, so we click on Add, and then locate the snippet folder:


We can see that the custom Snippets folder has been created and the 2 snippets are loaded.


After that, we can use the custom code snippets on any window we want.

Loading our Custom Snippet


Now you can load your custom code in any SSMS open query window, we will use it to know how much time is taking a DBCC command we are running on the other window:


For more information on T-SQL snippets, visit this link.

Wednesday, October 3, 2018

Query to determine XE Session status

On a previous post, we discussed what is an extended event (XE) and how to create one.

With the following T-SQL you can quickly check what are the currently running Extended Events sessions:


SELECT 
 ES.name,
 iif(RS.name IS NULL, 0, 1) AS running
FROM sys.dm_xe_sessions RS
RIGHT JOIN sys.server_event_sessions ES ON RS.name = ES.name
--WHERE es.name = '<YOUR XE SESSION NAME>'


The column running will show 0 if the session is currently stopped and 1 if it is currently running.
In the commented WHERE clause, you can filter for a specific session.

Hope this helps you to monitor your XE sessions!

Tuesday, July 10, 2018

Display SELECT query or table as HTML

https://bertwagner.com/2018/07/03/code-youd-hate-to-live-without-t-sql-tuesday-104-invitation/
This post is part of #tsql2sday event :)
For my current job I support a lot of SQL Servers, they come in all the flavors and sizes (old, new, patched, unpatched, big, small, dedicated, shared, built by our team, built by others... etc). In the ocean of different possible configurations, having a centralized monitoring solution is sometimes not possible for the 100% of the servers, because of different reasons (unsupported features for older versions, located in a different domain or datacenter, some weird security restrictions).

Even when we have already in place a custom inventory and monitoring solution (BTW done using C#, asp.net, SQL Server and Powershell), a couple of rogue servers, needs their own special treat, most of the cases this has to do with some kind of monitoring.

So, for these serves, the solution is to implement local jobs to monitor different kinds of stuff and send via email the monitoring and usage results.
We could perfectly send the info in plain text, but reading this in an email, especially when your boss is included in the distribution list is just awful, so we had to format the data first to make it look better...

That's why I created sp_TabletoHTML, a Stored Procedure to convert any table or SELECT query to an HTML table, so you just have to paste the output in your email body.

Before this stored procedure, we had to do the HTML conversion based on each table columns, and after 3 or 4 times of adapting the same code, I was tired and ended up doing this stored procedure.

How it works?


  • Create the stored procedure and remember where you left it (can be the master database, it really doesn't matter as long as you can access it properly).
  • Then you pass in @stTable (yes, Unicode varchar in case you have weird characters in your object names) the name of the table or view containing the data using the schema.name convention or you can also pass a SELECT query sentence, giving you the ability of formatting or cleaning up your data before converting it to HTML.
  • You can specify if want to include column names or not (included by default) or the predefined style you want or no style at all (or leave the parameters at their defaults)
  • Execute the stored procedure and use the output string as your HTML <table> result.
  • Enjoy!

Sample execution:

SET @SQLSentence = 'SELECT 
name,
state_desc,
create_date,
collation_name 
FROM sys.databases'

EXEC sp_TabletoHTML @stTable = @SQLSentence,
 @TableStyle = 3,
 @RawTableStyle = @st OUTPUT

And you will obtain a beautiful looking HTML table like this one:

Formats can vary...

What is the logic involved?


Just tweaking a little bit the FOR XML functionality, and a lot of column reformatting.
This is the core of the formatting, all the columns with the same name of TD that will translate into <td></td> and the rows that will translate into elements named <tr></tr>:


SELECT [COL1] as TD, [COL2] as TD...
FROM ##rowstablePreHTML 
FOR XML RAW('TR'), ELEMENTS


Since some of the queries are build dynamically, I use sp_executesql, that could be a security risk for untrusted sources.

For internal use, we did not check for malicious code, because... I trust my own code, but before releasing it into Github I added a very basic malicious code check (just check for keywords that has nothing to do with table results) and raise an error for any occurrence encountered. As a recommendation, always validate your queries first.

Null values are not converted to an empty string (because of the unique way XML handle their nulls).  Before using it, remove null values from your data.

Some special datatypes like geography, timestamp, XML, image are not supported, if you try to use them, an error will raise, remove these columns before using it.

Where is the code?

Fortunately for you, it is free!

I offer this stored procedure as open source in GitHub, you can check it here.
The link is also in the Free Tools section on this blog.

The full documentation is also available on the Github page, so you can check the parameter usage and some other examples there!

Also, if any of you can improve this SP, please do it, you are more than welcome!

Thursday, June 28, 2018

Check instant file initialization and lock pages in memory options

Study your server reports do the work for you!

Instant file initialization and lock pages in memory are 2 windows operating system options that can help us improve our overall SQL Server performance.
These options are already checked in the Server Dashboard report available in my free tools.

We will talk about both options and how to check them.

Note that these options are for SQL Server running under Windows OS, for Linux systems you can ask Carlos Robles via his webpage or twitter. He has a lot of experience working with databases (SQL Server, Oracle, MySQL, Sybase) running under UNIX environments.


Instant file Initialization


When you create any file on the operating system, any data left in disk is overwritten by filling with zeros all the file, that could take some time depending of the file size.
For SQL Server this is done when you restore a backup, perform an auto growth operation, create a data/log file (if you put an initial value of several GB this zeroing could take a long time to complete), so this can impact our SQL Server performance.
To avoid that, the zeroing operation can be skipped leaving the "dirty" data on the disk, improving the speed of file operations.

To check if instant file initialization is enabled


Just check the error log and find for the "instant file initialization" entry


exec master..xp_readerrorlog 0,1, "Instant file initialization"

This will tell you if it is enabled or disabled for your system


To enable Instant File Initialization


Starting SQL Server 2016, this option can be configured at setup by checking the "Grant Perform Volume maintenance task privilege to SQL Server Database Engine Service" option


If the option was not enabled during setup, or for older versions, you have to add SQL Server service account to the Perform volume maintenance tasks local policy on your system.
You can check how to do it here.


Lock Pages in Memory


This option allow any given OS process to keep data in the memory, instead of paging it to disk (virtual memory).
Enabling this option we can improve performance by making SQL Server process read pages from physical memory (of course if the page is available in memory).

To check if Lock Pages in Memory is enabled


Run the following query:


/*Lock pages in memory*/
SELECT
MN.locked_page_allocations_kb
FROM sys.dm_os_memory_nodes MN
INNER JOIN sys.dm_os_nodes N 
ON MN.memory_node_id = N.memory_node_id
WHERE N.node_state_desc <> 'ONLINE DAC'

If lock pages in memory is enabled, the value will be greater than 0.

To enable Lock Pages in Memory


You have to add the sql server service account to the Lock pages in memory policy.
You can check how to do it here.


Also remember, these options are already checked in the Server Dashboard report available in my free tools.


Sources:


https://docs.microsoft.com/en-us/sql/relational-databases/databases/database-instant-file-initialization?view=sql-server-2017

https://docs.microsoft.com/en-us/sql/database-engine/configure-windows/enable-the-lock-pages-in-memory-option-windows?view=sql-server-2017


Wednesday, May 16, 2018

Query to determine last statistics update for a database

Statistics are a vital part of SQL Server database engine, these are used for the query optimizer to create query plan.
These statistics store distribution information about one or more columns on tables and views, you can read more about how statistics works from Microsoft documentation in the first link.

On this post I am sharing a lightweight query to determine last update statistics date for each user table on a database. Please note that objects with null values are objects without statistics.
the ones with _WA_Sys names, are the ones generated automatically when you have enabled the AUTO_CREATE_STATISTICS option.

SELECT obj.name [table name],
 sp.stats_id,
 stat.name [stat Name],
 stat.filter_definition,
 sp.last_updated,
 sp.rows [object rows],
 sp.rows_sampled,
 sp.unfiltered_rows
FROM sys.objects obj
LEFT JOIN sys.stats AS stat --Include objects without statistics
 ON obj.object_id = stat.object_id
OUTER APPLY sys.dm_db_stats_properties(stat.object_id, stat.stats_id) AS sp
WHERE obj.type = 'U' -- Only user tables
ORDER BY [table name],
 last_updated

Remember that you can update them using the UPDATE STATISTICS option.

Friday, November 10, 2017

Query to determine mirrored database status

I am sharing today a SQL Script to quickly check on an instance which databases are in mirrored and their status.

select 
 db.name, 
 db.state_desc, 
 dm.mirroring_role_desc, 
 dm.mirroring_state_desc,
 dm.mirroring_safety_level_desc,
 dm.mirroring_partner_name, 
 dm.mirroring_partner_instance 
from sys.databases db
inner join sys.database_mirroring dm
on db.database_id = dm.database_id
where dm.mirroring_role_desc is not null
order by db.name
 
 
I hope you find this script useful! 

Thursday, September 28, 2017

Query to monitor disk space

One of the most common DBA tasks is to monitor disk usage.
You don't want your main user databases, or even worse your whole instance being down because of a full disk.

It is your duty to avoid that, and even this is something basic, a lot of DBAs fail on this.

An  easy way to determine disk usage, is using the following query, since it gave me info about each datafile in each drive, and its free space:

SELECT

DB_NAME(VStats.database_id) DBName,
mf.physical_name PhysicalFileLocation,
VStats.volume_mount_point AS Drive,
CONVERT(int,VStats.total_bytes/1048576.0) AS TotalSpaceInMB,
CONVERT(int,VStats.available_bytes/1048576.0) AS FreeSpaceInMB,
round((convert(float,VStats.available_bytes)/
convert(float,VStats.total_bytes))*100,2) as PercentFreeSpace

FROM sys.master_files mf
CROSS APPLY sys.dm_os_volume_stats(mf.database_id, mf.FILE_ID) VStats

ORDER BY PercentFreeSpace

You can then use it in a job or custom report so you can receive an alert when usage is low.

Source:

https://docs.microsoft.com/en-us/sql/relational-databases/system-dynamic-management-views/sys-dm-os-volume-stats-transact-sql


How I Built RAG for My Accounting App on Bedrock and pgvector

The first version of my accounting assistant could not find a single purchase of "comida" in a database full of lunches, misse...