Friday, May 25, 2018

Add a custom report to SSMS

Maybe some of you don't know this, but to view Report Definition Language reports (RDL) , you aren't forced to use SQL Server Reporting Services and a report server running on the machine.

With the latest version of SSMS you are able to view any report, just have in mind 2 things when creating your report to be able to use it on SSMS:
  1. Use an embedded Dataset for your report and point the server name to (local)
  2. Add the database name to your objects if you want a specific db, otherwise, SSMS will use the current db or the master as default.
You can create RDL reports (among other projects) with the free tool SQL Server Data Tools (SSDT) who is the replacement for the old Business Development Integration Studio(BIDS).

Once you have your report created, it is just matter of importing it to SSMS to use it. I will show you how to do it.

Add the report to SSMS


For this example I am using one of my open source reports for server monitoring.

First, connect to your server using SSMS and right click on the server or database, then select Reports>Custom Reports...


Locate the report file on your windows explorer. Note: If you want another name for the report, rename the file on this point, then select it and click OPEN.


A Warning will appear for any custom report you add, and again I tell you: Always review the source of any custom code before using it to avoid malicious executions against your servers, also test them in a non-prod server before. As advice: trust no one.
If you trust on the source, then ignore the warning and click RUN.


After that, the custom report will appear, note that the connection has been changed to the current server where the report is being executed.
BE CAREFUL: Report runs with the credentials of the user connected to the SSMS at that point, so have this in mind for sensitive information or object permissions.


After that, the report will be available for you to execute it at any time.


To Delete it


Reports are not "imported" to SSMS, so if you want to delete it, just delete the rdl file on the windows explorer, after that if you select it again in SSMS it will prompt to delete it from recent list.


Wednesday, May 16, 2018

Query to determine last statistics update for a database

Statistics are a vital part of SQL Server database engine, these are used for the query optimizer to create query plan.
These statistics store distribution information about one or more columns on tables and views, you can read more about how statistics works from Microsoft documentation in the first link.

On this post I am sharing a lightweight query to determine last update statistics date for each user table on a database. Please note that objects with null values are objects without statistics.
the ones with _WA_Sys names, are the ones generated automatically when you have enabled the AUTO_CREATE_STATISTICS option.

SELECT obj.name [table name],
 sp.stats_id,
 stat.name [stat Name],
 stat.filter_definition,
 sp.last_updated,
 sp.rows [object rows],
 sp.rows_sampled,
 sp.unfiltered_rows
FROM sys.objects obj
LEFT JOIN sys.stats AS stat --Include objects without statistics
 ON obj.object_id = stat.object_id
OUTER APPLY sys.dm_db_stats_properties(stat.object_id, stat.stats_id) AS sp
WHERE obj.type = 'U' -- Only user tables
ORDER BY [table name],
 last_updated

Remember that you can update them using the UPDATE STATISTICS option.

Monday, May 14, 2018

Quick charts in SQL Server Operations Studio

Sample chart for quick insights
SQL Server Operations Studio will be a new tool for managing SQL Server, Azure SQL Database, and Azure SQL Data Warehouse, this tool is not meant to replace SSMS, and is focused more to Database Developers than for Database Administrators.

On this post I want to share with you an option to create quick charts from the results window.


View data as chart


Open SQL Server Operations Studio and select a new query (Ctrl + N)


Once you have your new query window and you are connected to your server, write your query (just note that since this is a quick function, it won't work properly for complex charts)


Run your query clicking the run button or hitting F5 (Ctrl +F5 for selected text) and once the results are displayed, select the View as Chart option in the right of the results window


When you click this option, an horizontal bar chart will open by default, but you can change the chart type on the right side


Also if you hover the mouse over a point, it will display the value.
You can save the chart also if you want or create an Insight template with the options above the chart.


And that's all. As you can see, the customization options are very limited, but the product is still in preview, so new features can come in newer releases.

If you haven't download the SQL Server Operations Studio, you can do it from Microsoft Site here


More info:

What is Microsoft SQL Operations Studio (preview)?

Tuesday, May 8, 2018

Quick tip: Refresh IntelliSense cache in SSMS

If you work with multiple windows or make a change using SSMS to an object, sometimes IntelliSense does not reflect the changes in your code, to update recent changes you need to refresh the local cache.

This option is located in SSMS, under Edit>IntelliSense>Refresh Local Cache or just hitting Ctrl+Shift+R


Monday, April 30, 2018

Security: Create and view Audit Logs

It is important to have a secure environment, enforcing the least privilege principle in your servers and databases, but this can be difficult to achieve on large environments, where a lot of people have elevated privileges or several people have permissions to perform tasks over your data or schema.

As an additional measure, an audit log should be implemented in those scenarios and review these often.

SQL Server provides the functionality to implement audit logs at Server and Database level. Starting SQL Server 2008, all SQL Server editions support Server level audits. Database audits are supported beginning with SQL Server 2016 (13.x) SP1. Prior to that, database level auditing was limited to Enterprise, Developer, and Evaluation editions.

On this post I will show you how to configure and view audit logs:


Implement Audit Log


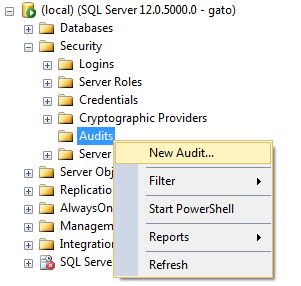
Under security, go to Audits and select New audit...


Specify a name for the audit and select an audit destination (I personally prefer a file location).
Select the desired parameters and click OK.


The Audit is now created, for it to work just enable audit.
NOTE: before making any changes to the audit configuration, you will need to disable it first.


Implement Server Level Audit


We have created our audit location, now we will proceed to create the actions we want to audit at server level.

Under Security folder, locate  Server Audit Specifications, right click and select New Server Audit Specification...


In the next window, Specify a name for the audit (you can have more than one) and select the audit created in the previous step.


Choose the action or actions to be audited. To check what is included on each action, please read here from Microsoft documentation.

Once you are done click OK to create the audit specification.
For this example I just have included the DBCC action to be audited (as we will see later on this post)


The Audit specification is also created disabled, to make it work, enable it as shown in the image.


NOTE: before making any changes to the audit specification, you will need to disable it first.


Implement Database Level Audit


The process is relatively the same to create a database level audit specification, the main difference is that the option is located under the Security folder on each database.

Right click on the Database Audit Specification folder and then New Database Audit Specification...


Select the name of the Database Audit and the audit destination (the same created in first step for this example).
Another of the key differences for Database Audits is that we have to select the object or schema we want to check.
Select the actions to audit (you can see description for each one here), and then click Ok.

For this example I will audit the SELECT command over the a table named Course in a sample School database.


After the creation of the audit specification, you must enable it to run.


NOTE: before making any changes to the audit configuration, you will need to disable it first.


Review audit logs


Having the audits configured and running is just half of the work, it will worth nothing if you don't proactively review the logs often.
There are 2 options to review the logs, using SSMS and T-SQL

For this example I have executed some sentences to trigger the server and database audits configured above so we can see some data.

SSMS


To check event logs using Management Studio, just select the Audit created, right click on it and select the View Audit Logs option


The audit log will display in a SQL Server log kind type, and you can see some of the examples I have triggered


T-SQL


For using this option, you use the DMF sys.fn_get_audit_file, specifying the file location, and for file name use *.sqlaudit to include all the files.

This is the query I use for this example:


SELECT event_time,action_id,statement,database_name,server_principal_name 
FROM sys.fn_get_audit_file ('C:\temp\TestAudit_*.sqlaudit',default,default);  

The output of the query looks like this:


I have marked in yellow the actions that have been captured in the database specification.


With this info you are good to go configuring your own audits for your Mission critical servers and review them often, also you could implement an alert or automatic reporting logic to be notified on suspicious activity.

Sources:

https://docs.microsoft.com/en-us/sql/relational-databases/security/auditing/sql-server-audit-database-engine?view=sql-server-2017

https://docs.microsoft.com/en-us/sql/relational-databases/security/auditing/sql-server-audit-action-groups-and-actions?view=sql-server-2017

Wednesday, April 25, 2018

Quick tip: format source code in html

I run a technical blog, so it is necessary to put code in almost every post. Most of the GUIs we use to do our work (let's say SSMS or Visual Studio) already provide this functionality, but when you copy and paste the code to the blog, you need to format it first, to pass from this:

DELETE FROM database1.schema1.table1 WHERE column1=valuex
/* generic comment */
SELECT * FROM database2.schema2.table2 WHERE column2=456

To this:

1
2
3
DELETE FROM database1.schema1.table1 WHERE column1=valuex
/* generic comment */
SELECT * FROM database2.schema2.table2 WHERE column2=456

These are some sites I use:

http://hilite.me/ 

My site of choice, it supports several languages and you can select predefined styles and customize them on-site.

http://poorsql.com/

Only for SQL, it provides a more robust keyword detection, but the format and customization is more limited, it also offers some obfuscation options.

http://www.dpriver.com/pp/sqlformat.htm

Also a good option, supports various languages, but a little bit more complex to use than hilite.me

Monday, April 23, 2018

Configure Min and Max memory in Reporting Services


As any of the available SQL Server services, Reporting Services will use all of the server memory if needed, in some cases when you have multiple products configured for the same server, you need to limit these values, we use WorkingSetMaximum and WorkingSetMinimum configuration values to achieve this task.

Where to set these values?


Find the .config file


We need to localize the RsReportServer.config configuration file in our server, this file is in the SQL Server installation folder under MSRS00.XXXX\Reporting Services\ReportServer where the 00 is your reporting services version and the XXXXX are your instance name.
NOTE: Before changing any parameter in this file, also take a backup of the file contents first.

Find the Service tag


Once you have located the file, proceed to find the <Service></Service> tags, and add the <WorkingSetMinimum> and <WorkingSetMaximum> as desired, values are specified in kilobytes, so for example, to set a value of 4 GB you must put 4000000.
You can see a sample code of a min memory of 2GB and a max memory of 4 GB


<Service>
 <MemorySafetyMargin>80</MemorySafetyMargin>
 <MemoryThreshold>90</MemoryThreshold>

 <WorkingSetMinimum>2000000</WorkingSetMinimum> 
 <WorkingSetMaximum>4000000</WorkingSetMaximum>  
</Service>


When the value for WorkingSetMaximum is reached, the report server does not accept new request, so please have this in mind before configuring this value.
Also note that a service restart is required for the values to take effect.


Source:

https://docs.microsoft.com/en-us/sql/reporting-services/report-server/configure-available-memory-for-report-server-applications?view=sql-server-2017

Five Ways Redshift Serverless Quietly Eats Your Budget

It is Friday, the queries are running, and nobody is watching the bill. That is the whole charm of Redshift Serverless: you stop think...